
Cooling Tower Approach: The Physics of a Number You Can Trust
Approach is the gap between the cold water temperature (CWT) leaving the tower basin and the wet-bulb temperature (WBT) of the air coming in:
Approach = CWT - WBT
Wet-bulb is the floor for evaporative cooling. It is the temperature air reaches once it can hold no more moisture, and no evaporative device pushes water below it. Approach measures how far a tower still has to go, which is why it says more about tower condition than most load-based numbers.
Evaporative rejection across the fill
In the fill, water spreads into a thin film and air crosses it, usually in counterflow. Two things happen at once. Sensible transfer hands heat from warm water to cooler air. Latent transfer evaporates a small share of the water, and each pound that evaporates carries off about 1,000 Btu. In a tower that is running properly, evaporation carries most of the load: 70 to 80 percent of total heat rejection.
The vapor pressure difference between the water surface and the moving air drives the process. As the water cools, that difference narrows and heat transfer slows with it. Water temperature therefore closes on wet-bulb along a curve, not a straight line, as the diagram below shows.
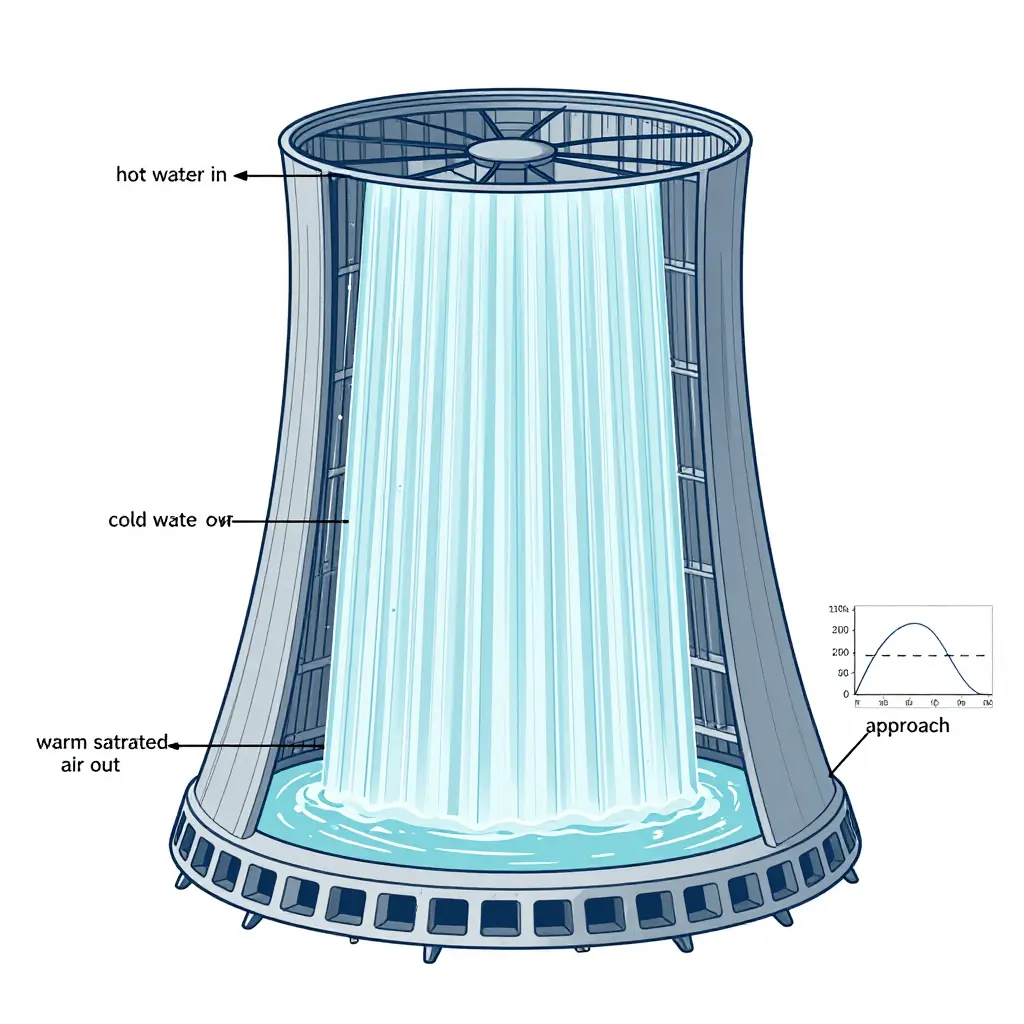
Why approach can never be zero
Hitting zero approach would put the leaving water exactly at wet-bulb, which takes infinite fill depth, infinite contact time, or infinite airflow. Once the air is saturated there is no vapor pressure gradient left to evaporate water into. Approach is the unavoidable cost of finite equipment. In practice towers land between 4 and 12 degrees Fahrenheit at design, and premium units can be specified below 3.
How design approach is established
Design approach gets proven at commissioning, not assumed. A certified thermal test runs at a known flow rate, entering water temperature, and entering wet-bulb, and the measured approach is checked against the manufacturer’s performance curve, normally under the CTI (Cooling Technology Institute) ATC-105 acceptance test code or its STD-201 certification. That result becomes the reference for every later reading. It also sets cooling tower efficiency, which is range divided by range plus approach, expressed as a percentage:
| Parameter | Definition | Design example |
|---|---|---|
| Hot water temperature (HWT) | Water entering the tower | 95 F |
| Cold water temperature (CWT) | Water leaving the basin | 85 F |
| Wet-bulb temperature (WBT) | Saturated entering air | 78 F |
| Range | HWT – CWT | 10 F |
| Approach | CWT – WBT | 7 F |
| Effectiveness | Range / (Range + Approach) | 58.8% |
Approach is load independent when the tower is healthy
This is what makes approach so useful: in a healthy tower it holds roughly steady across a wide load band. Cut the load and the range shrinks, but approach hardly budges, because geometry and airflow set it, not the heat load. A single approach reading plus a wet-bulb reading tells you something no load-dependent metric will.
The three levers that actually set approach
- Fill surface area. Film fill puts a lot of wetted surface into a small volume. Airborne dirt, scale, biofilm, and crushed or sagging sheets take that surface out of service. Less surface means less contact, and approach climbs.
- Air-to-water flow ratio (L/G). L/G is the mass flow of water over the mass flow of air. More air per unit of water pulls approach down. Fan output that is restricted, fouled fill, or over-pumping the tower raises L/G and pushes approach up.
- Water distribution. Nozzles, basins, and hot deck design decide whether the fill gets wetted evenly. Bypass, channeling, and dry patches leave part of the fill idle while the wetted portion takes more than its share.
The signal to watch: approach creep
Approach creep is a slow, year-over-year rise in approach at the same wet-bulb and flow. It moves by fractions of a degree, so it hides well, but it means the fill is losing surface or the air path is narrowing. Every degree of added approach raises the condensing temperature the chiller has to reach, and the compressor pays for that lift in kilowatt-hours hour after hour. Trend approach and you find fouled fill months before it turns up on a utility bill.
The takeaway
Approach is not a nameplate figure to file away. It is a live reading of how close the tower is running to the limit the weather sets. Log it, trend it, and treat an upward drift as a cue to inspect, because it is the earliest and least expensive warning that cooling tower efficiency is slipping.
Fill Condition vs. Measured Approach: A Comparison Table
Use the table below to compare what you see in the basin and on the fill with what the condenser water loop is telling you. It ties visible fouled fill symptoms to approach creep and the drag both put on cooling tower efficiency and chiller energy use.
| Fill Condition | Expected Approach (°F / °C) | Change in Approach | Relative Heat Transfer Efficiency | Typical Emerging Energy Impact |
|---|---|---|---|---|
| Clean / New fill | 3-5 °F / 1.7-2.8 °C | Baseline (0 °F) | 100% (reference) | Baseline chiller lift; lowest kWh per ton-hour |
| Light scale (dust, mild mineral film) | 6-8 °F / 3.3-4.4 °C | +2 to +3 °F / +1.1 to +1.7 °C | ~85-90% | +2-4% chiller power; negligible fan penalty |
| Moderate biofilm / fouled fill | 9-12 °F / 5.0-6.7 °C | +5 to +7 °F / +2.8 to +3.9 °C | ~65-75% | +5-9% chiller power; rising fan energy to chase setpoint |
| Heavy scale / channeling | 13-17 °F / 7.2-9.4 °C | +8 to +12 °F / +4.4 to +6.7 °C | ~45-60% | +10-18% chiller power; noticeable condenser-water penalty |
| Collapsed / crushed fill | 18-25 °F / 10-13.9 °C | +13 to +20 °F / +7.2 to +11.1 °C | ~25-40% | +15-30% chiller power; capacity shortfall, forced staging or lockout risk |
Caption: Illustrative values showing typical field ranges for a mid-size induced-draft tower near a 78 °F (25.6 °C) design wet-bulb. Real results depend on load, wet-bulb, airflow, water distribution, and water treatment. Treat this as a screening tool, then confirm with a logged approach trend and a performance test. The trend is consistent: as fill degrades, approach rises, condenser water warms, chiller lift grows, and kWh per ton-hour with it. Catching that creep early is one of the cheapest ways to keep tower efficiency from turning into a chiller problem.
These are the field signs that fill has fouled and approach is creeping. Watch for them and you can schedule cleaning before chiller lift climbs and kWh consumption drifts up.
- Rising leaving cold-water temperature. The outlet stops holding design setpoint even with a favorable wet-bulb reading – usually the first clear sign of approach creep.
- Approach widening in trend logs. Plot leaving water temperature minus wet-bulb over 30 to 90 days. A steady upward slope means fouled fill is cutting heat rejection.
- More fan run time. Cells that once held load at part speed run at full rpm longer, or extra fans stage on earlier in the day, because the fill no longer transfers heat as designed.
- Warmer condenser water supply. Warmer water back to the chiller raises condensing pressure and compressor lift, so the machine works harder for the same cooling output.
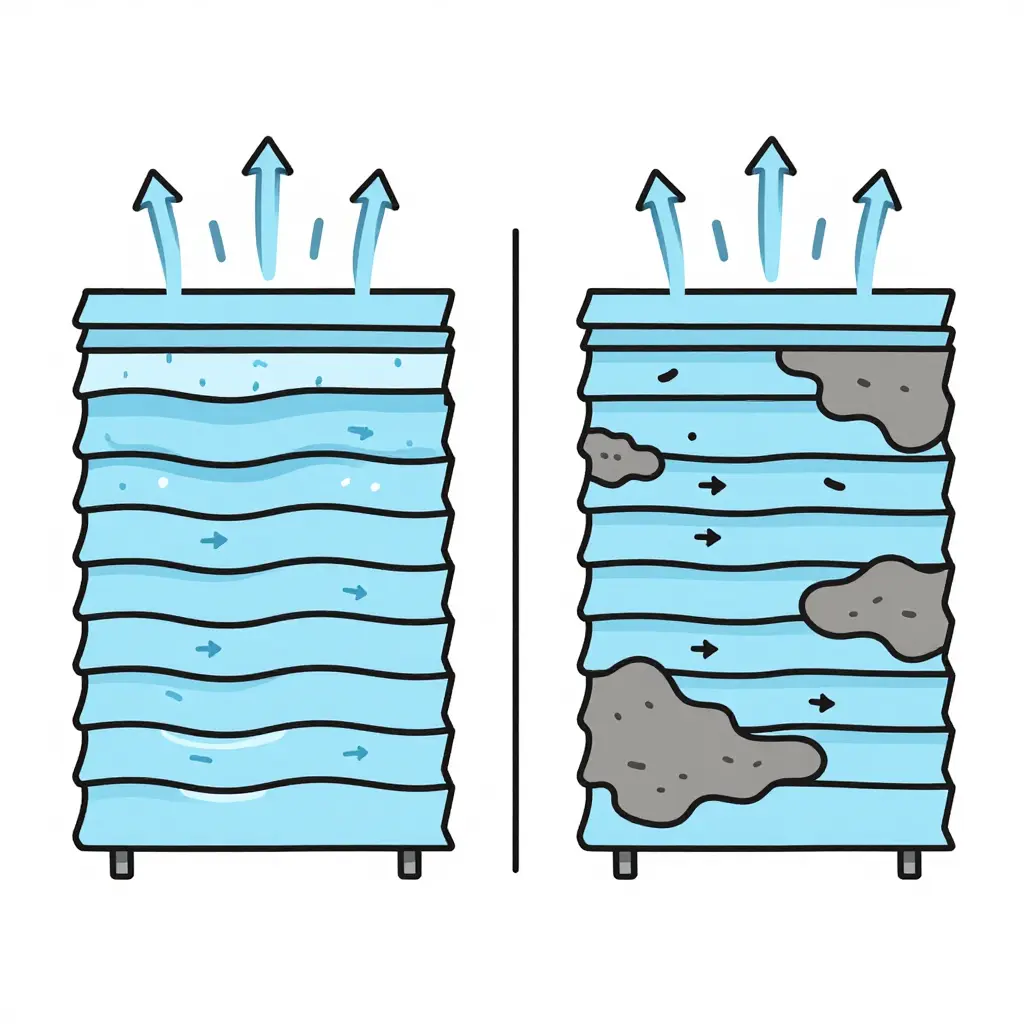
- Visible scale, silt, or biofilm. Chalky deposits, mud, or slick organic film coat the air passages and cover the wetted surface where evaporation should happen.
- Channeling or dry patches. Water runs in streams through gaps while other sections stay dry – a sign fouled fill is no longer spreading water evenly.
- Uneven cell-to-cell performance. One cell consistently warmer than its neighbors usually means localized fouling is already pushing approach up across the plant.
Log these signals weekly, so cleaning, water treatment, or fill replacement happens on your schedule instead of after a capacity shortfall forces it.
How Approach Creep Raises Chiller Lift and Quietly Steals Efficiency
A chiller compressor has one job: move refrigerant against the pressure difference between the two sides of the cycle. Widen that difference and it burns more power for the same tonnage. The difference is chiller lift, and it explains how a slowly fouling cooling tower can waste thousands of dollars before anyone notices a problem.
What “chiller lift” actually means
Chiller lift is the spread between condensing pressure/temperature on the high side and evaporating pressure/temperature on the low side. The compressor lifts vapor from evaporating pressure up to condensing pressure, so lift is the work it has to do. More lift, more compressor work, and fewer tons of cooling per kilowatt consumed.
The condenser sets the high side of the lift, and the condenser is cooled by water returning from the tower. That is where the tower stops being a passive accessory and starts controlling chiller efficiency directly.
Where approach creep enters the equation
Tower approach is the gap between leaving water temperature and ambient wet-bulb. A clean, well-designed tower might hold 5 degrees F. Over time, scale, biofilm, and clogged or degraded fill cut the air-to-water contact area, so the tower cannot pull the water as close to wet-bulb as it once did. The gap widens – and that slow widening is approach creep.
Warmer water leaves the tower, flows into the condenser, and absorbs less heat there. To reject the same condenser heat load, the refrigerant has to run at a higher temperature.
Cause and effect: warmer water, higher condensing temperature
Follow it through. Approach creep raises the leaving water temperature. That water enters the condenser. Refrigerant only condenses while it is hotter than the cooling water, so warmer water forces a higher condensing temperature and a higher condensing pressure. Now the compressor has to push vapor from the same evaporating pressure to a higher discharge pressure. Compressor lift grows.
Remember the one-to-one relationship: each degree of added approach pushes condensing temperature roughly a degree higher and adds to compressor lift.
Why it hits COP and kW-per-ton
The efficiency cost follows. More lift means more energy per unit of cooling. COP drops and kW-per-ton rises. A common engineering rule of thumb is that each degree F of added condensing temperature costs roughly 1 to 2 percent of chiller efficiency. The table below shows the shape of it for a nominal centrifugal machine.
| Cooling tower approach (F) | Leaving tower water (F) | Approx. condensing temperature (F) | Compressor lift | Relative chiller efficiency |
|---|---|---|---|---|
| 5 (design) | 85 | 95 | Baseline | 100% |
| 8 | 88 | 98 | Higher | ~95% |
| 12 | 92 | 102 | Much higher | ~90% |
Illustrative values for a nominal water-cooled centrifugal chiller; exact figures vary with refrigerant and machine type.
None of this looks like a failure. The chiller still cools, the tower still runs. But every operating hour now costs extra kWh, and in facilities with long cooling seasons – commercial kitchens and dining operations among them – that adds up over a year. Where refrigeration and comfort cooling share a plant, the same lift problem lands on the whole building’s electric bill.
The takeaway
Approach creep is a mechanical problem with an energy symptom. It raises condensing temperature, that raises chiller lift, and lift is the compressor’s workload, so COP and kW-per-ton degrade in proportion. Tracking tower approach and cleaning or replacing fouled fill is one of the best-value maintenance moves available, because it fixes the cause of high compressor lift instead of compensating for it downstream.
Approach Creep vs. Chiller kWh: The Trend Over Time
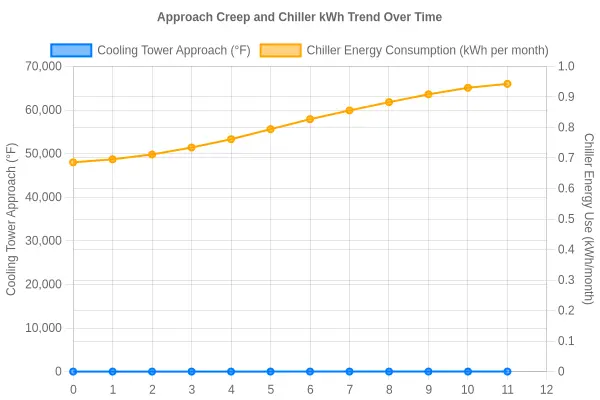
Caption: Cooling tower approach (solid blue, left axis, degrees F) and chiller energy use (dashed orange, right axis, kWh per month) plotted month by month since the last fill cleaning. The two lines climb almost together, approach moving from 5 to 11.5 degrees F as chiller energy goes from roughly 48,000 to 66,000 kWh per month. That is a 37.5% increase in kWh, and it is the invisible cost of fouled fill.
Quantifying the kWh Penalty From Fouled Fill
Fouled fill rarely fails loudly. It drifts. A bit of scale, a bit of biological growth, and fill that once held approach at 5°F now sits at 9°F. The tower still cools. The building stays comfortable. Nobody complains. That is exactly why the energy penalty compounds month after month. Putting a defensible number on the drift is what turns an inspection note into an approved repair.
From approach creep to chiller lift
Approach is the gap between the leaving condenser water temperature and the ambient wet-bulb. Fouled fill widens the gap, so condenser water reaches the chiller warmer than design intended. In a water-cooled chiller, condenser water temperature and refrigerant condensing temperature move almost together, so a rise in approach brings a similar rise in condensing temperature. Higher condensing temperature means more chiller lift – the compressor pushes refrigerant across a bigger pressure difference – and more lift always means more compressor power per ton of cooling delivered.
The kW/ton sensitivity shortcut
No full thermodynamic model is needed to size the penalty. For water-cooled centrifugal and screw chillers, a widely used rule of thumb is that each 1°F of added condensing temperature adds roughly 1.5% to 2% to compressor power at typical conditions. Part-load operation and some compressor types sit a little lower; older or oversized machines can be worse. Treat it as a sensitivity, never a promise.
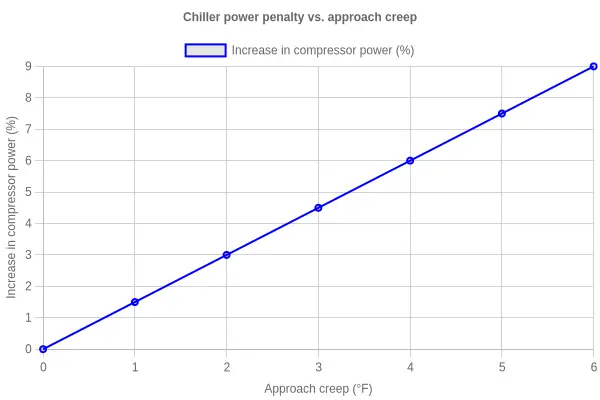
Estimating added kWh: a short method
- Measure approach now and compare it with a clean-fill baseline.
- Convert approach creep to condensing temperature – roughly one-to-one for condenser water.
- Multiply by the kW/ton sensitivity to get a percent power increase.
- Apply that percent to the chiller’s actual kW/ton or running kW.
- Multiply the added kW by annual full-load-equivalent hours to get kWh.
Putting simple figures to it
Take a chiller rated at 0.60 kW/ton drawing about 300 kW, with fill that has crept approach by 4°F.
| Approach creep | Power increase at 1.5%/°F | kW/ton from 0.60 | Added kW at 300 kW draw |
|---|---|---|---|
| 1°F | 1.5% | 0.609 | 4.5 |
| 2°F | 3.0% | 0.618 | 9.0 |
| 4°F | 6.0% | 0.636 | 18.0 |
| 6°F | 9.0% | 0.654 | 27.0 |
At 4°F of creep the added draw is about 18 kW. Over 3,000 full-load-equivalent hours that is roughly 54,000 kWh of pure waste – and it does not count the extra tower fan energy spent chasing a setpoint the tower can no longer reach.
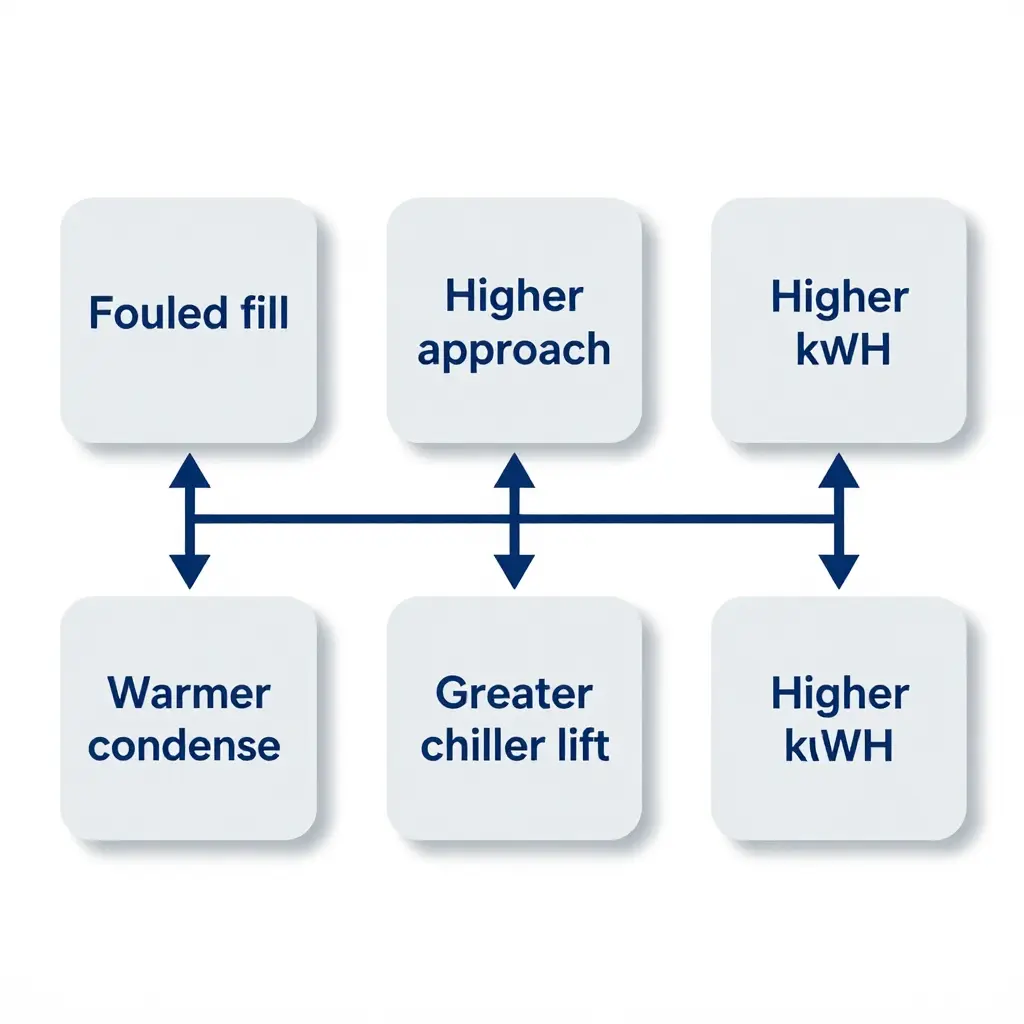
That is the cost of fouled fill: not a dramatic failure, just a steady tax on every cooling ton. Whether the chiller serves a data hall or a high-volume dining operation, the arithmetic is the same.
Operational and Cost Impact for Facility Budgets
The kWh penalty from cooling tower approach creep does not stay on a commissioning report or a trend log. It turns into money on the utility statement, water and chemistry in the treatment budget, and risk in the capacity margin. For facility managers and energy auditors, the work is tracing that chain from fouled fill to the annual budget.
Every degree of approach becomes energy cost
Approach is the gap between the leaving water temperature and the entering wet-bulb. When fill fouls, airflow and water contact degrade and the gap widens. A wider approach forces the condenser to reject heat at a higher temperature. Higher condensing temperature raises chiller lift, so the compressor works harder to move the same heat.
Chillers are usually the single largest electrical load in a commercial building, so this is no rounding error. The extra kilowatts run every hour the plant operates, which means the cost grows with runtime.
Demand charges magnify the penalty
Energy cost is not only total consumption. Many tariffs carry a demand charge set by the highest 15- to 30-minute interval of the month, and that interval usually falls on the hottest afternoon. When fouled fill weakens heat rejection, the chiller pulls more power right at the building’s peak, so the ratchet is set higher and stays with the account for months.
Water treatment consumption climbs
Uneven water distribution and degraded fill surface raise drift, evaporation, and blowdown. More makeup water is needed, along with more chemistry to keep dissolved solids in check. Both the water and the treatment line items move up.
Cooling capacity margin shrinks at design conditions
A degraded tower cannot hold design approach on the hottest, most humid days. The chiller loses available capacity just when load is highest, which eats into comfort margin and can force staging, load shedding, or a temporary setpoint change.
The table below maps each mechanism to a budget line:
| Effect | Mechanism | Budget line affected |
|---|---|---|
| Higher energy cost | Increased chiller lift | Electricity (kWh) |
| Higher demand charges | Peak power draw during heat waves | Monthly demand ratchet |
| Rising water and chemistry use | More makeup and blowdown | Water treatment |
| Lost capacity margin | Wider approach vs. design | Contingency and tenant comfort |
| Rising maintenance | Scale, biofilm, and drive strain | Labor and parts |
How it accumulates across a cooling season
Approach creep is gradual, which is why its cost slips by. The penalty is small in spring, when loads and wet-bulb temperatures are moderate, and grows as hotter months add runtime and higher lift. By late summer the accumulated energy cost and the demand ratchet together make up the biggest share of the loss.
Maintenance budgets and equipment life
Persistent approach creep also shows up in maintenance budgets. Biofilm and scale on the fill mean more cleaning, and running at high lift for months stresses the compressor, condenser, and fan drive. Season after season that shortens equipment life and pulls capital replacement forward. Monitoring approach catches the trend early and keeps those costs from stacking up.
Where Cooling Tower Energy Loss Hides
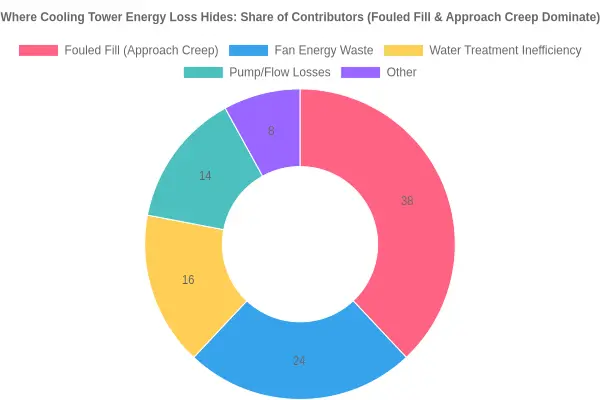
Figure: Illustrative breakdown of cooling tower energy loss contributors. Fouled fill and approach creep take the largest single share (38%), which is why fill inspection belongs near the top of any efficiency checklist.
Mitigation and Maintenance: Recovering Lost Chiller Efficiency
Once the cost of warmer condenser water is quantified, the next move is recovery. Approach creep rarely reverses on its own. Tower troubleshooting is not guesswork, but it rewards a fixed order of work: establish a baseline, watch how the tower behaves, then go through the mechanical and water-side checks. Done right, the process restores cooling tower efficiency and trims the chiller lift behind your electric bill.
-
Establish a clean-tower approach baseline. Before you can claim the tower has degraded, document what “good” looks like. After a thorough cleaning or a known-good commissioning, log approach (leaving water temperature minus entering wet-bulb temperature) across a range of load and weather. Record it at a fixed fan speed or fixed leaving-water setpoint so readings are comparable. This is your reference. Without it, every later reading is just a number, and approach creep stays hidden until the chiller is already suffering.
-
Trend approach against wet-bulb temperature. Plot approach against wet-bulb daily, using a building automation trend or a spreadsheet. A healthy tower holds a fairly flat curve; a climbing one is the early warning. Approach is temperature-independent while the tower is clean, so upward drift points to a physical cause – fouling, water distribution, or airflow – not the weather. Note the date the drift started so you can tie it to a maintenance event.
-
Inspect and clean the fill. Heat and mass transfer happen in the fill, so look there first for fouled fill. Get in and check the flutes for scale, biological slime, and debris. Even a light biofilm or mineral crust cuts surface area and blocks air passages, and both widen approach. Clean using the fill manufacturer’s approved method, hand tools where you can, and low-pressure water so the sheets do not get crushed. Document approach before and after cleaning on the same day.
-
Replace degraded or collapsed fill. Cleaning cannot rescue fill that has failed physically. Look for sagging, channeling, crumbling edges, and sheets packed tightly enough that air bypasses them. Collapsed fill starves the tower of surface area and distorts airflow, locking in a poor approach. Budget for replacement when inspection shows more than minor damage, and specify the film thickness and flute pattern the duty calls for instead of a cheaper generic sheet.
-
Correct water distribution and nozzles. Uneven distribution leaves dry patches where air short-circuits and wet patches where the fill floods. Check every nozzle and distribution basin for clogs, broken spray heads, and misalignment. Clean or replace plugged nozzles, and confirm the spray covers the full fill face without overspray on the walls. Re-level the distribution pans so gravity spreads water evenly, then re-check approach to confirm the fix.
-
Verify airflow and fan performance. Low airflow looks like fouling and can raise approach on its own. Check blade pitch, belt tension or gearbox condition, motor amperage, and cylinder or damper position. Make sure dampers open fully and there is no recirculation or obstruction at the air inlet. Compare measured airflow and fan power against design; a fan running below spec quietly adds degrees to your approach.
-
Re-commission after corrections. After each fix, run the tower through the baseline conditions and compare like for like. Adjust the fan control sequence, drop unnecessary staging, and reset leaving-water setpoints to match the new performance. Then set a preventive schedule – quarterly fill and nozzle inspection, seasonal cleaning, continuous approach trending – so the next round of approach creep is caught early and the chiller keeps running at the lowest lift available.
The Bottom Line: Fouled Fill Is Never a Free Problem
The consequences run in a short, unforgiving chain. Fill fouls, air and water stop meeting efficiently inside the tower, leaving water temperature drifts up, and cooling tower approach creep sets in. That creep is not a cosmetic issue. It raises the condensing temperature the chiller works against, which means higher chiller lift and a compressor burning more power for every ton of cooling it delivers.
The resulting kWh penalty never announces itself. It hides in a monthly utility bill that is a little higher, a capacity margin that is a little thinner, and a chiller that runs longer and hotter on the worst days of the year. A failed motor or a burst pipe gets attention; fouled fill just degrades, and the cost adds up while the equipment still looks like it is working.
Key Takeaways
- Fouled fill is the root cause: it restricts airflow and water distribution and degrades heat rejection at the source.
- Cooling tower approach creep is the symptom: the gap between leaving water temperature and wet-bulb temperature widens gradually.
- Chiller lift rises as a result, and the compressor has to work against a higher condensing pressure.
- kWh consumption climbs measurably, showing up as higher energy cost and less available cooling capacity.
- The penalty runs continuously, not occasionally, and compounds until the fill is cleaned or replaced.
Where to Go From Here
The fix is practical. Inspect fill condition, water distribution, and airflow, then restore performance with cleaning, fill replacement, and balanced water flow. Recommissioning brings approach back toward its design value, lowers chiller lift, and turns wasted kilowatt-hours into savings.
Fouled fill is a maintenance problem with an energy bill attached. Treat it that way, and the return shows up as lower consumption, restored capacity, and more predictable operating costs.